A component for rendering in a variety of human readable forms information received by a stream-processing engine (SPE) that detects interesting events.
A novel methodology to process localization data streams using a new class of data processing systems called continuous stream-processing engines. The advantages of our approach include the ability to express interesting events and behavior in terms of continuous-queries expressed in a structured stream-oriented query language. Besides the extensibility that this allows, our approach offers the ability to scale the stream-processing engine as the volume of events increases and to tolerate failures in the underlying infrastructure. We have integrated an open-source SPE with an interactive museum exhibit within which a computer vision system uses cameras to track the position of visitors.
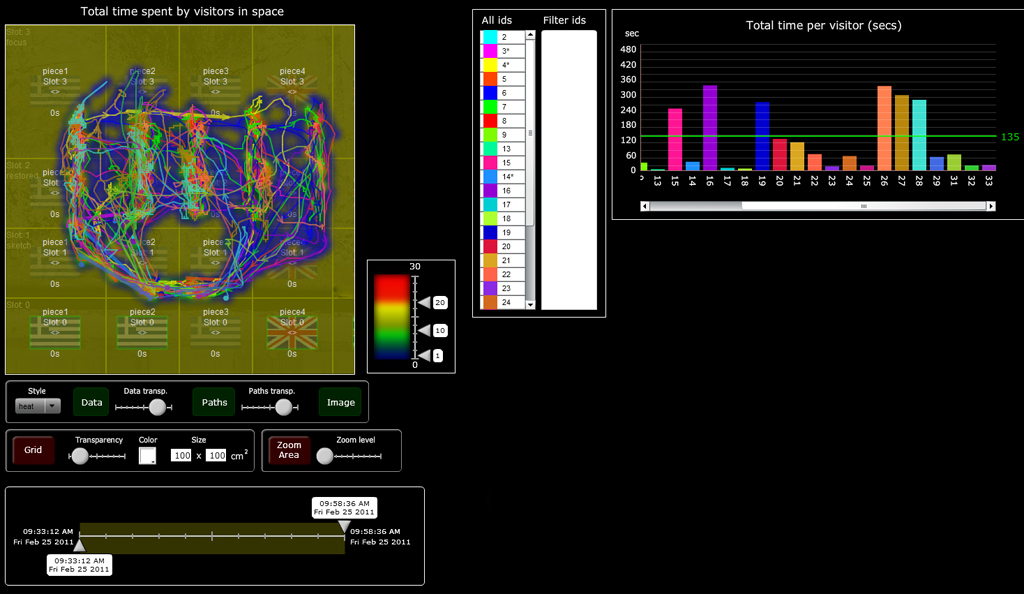
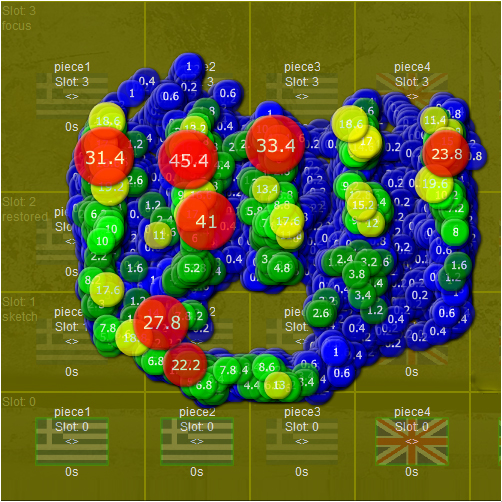
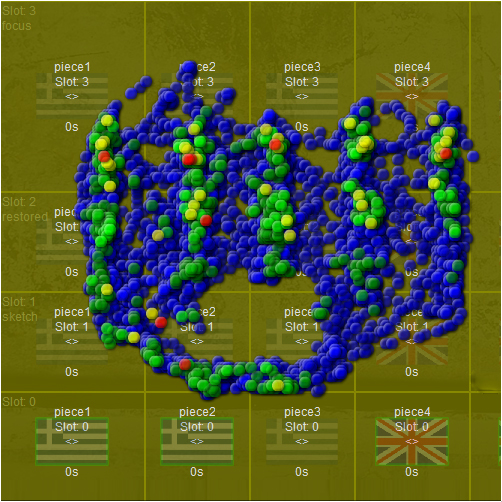
The SPE analyzes and stores data on-the-fly and feeds a visualization component which presents quantitative and qualitative information about the exhibit’s visitors. More specifically, the SPE propagates: User position; Accumulated time spent by visitors in specific positions; Total time spent by each visitor in the exhibit, average time for all users; “interesting” or “abnormal” patterns, such as: (i) too long distance between consecutive user positions; (ii) too short / long user stays in the room; (iii) incomplete user visits (where a user appears or disappears in locations other than entries/exits). The visualization component interacts with the SPE to set parameters such as type of data it is “interested” in and how to analyze and interpret them (e.g., how long should the distance between user observations be to be considered “abnormal”).
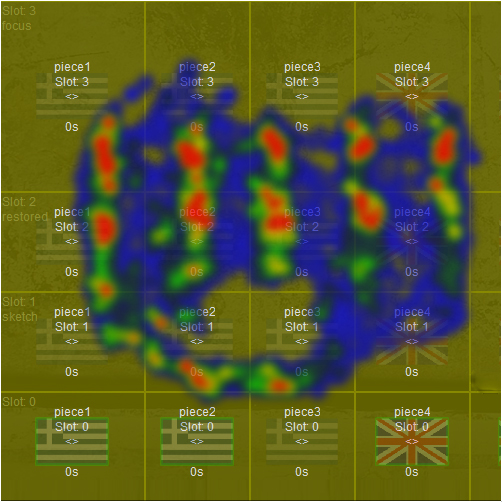
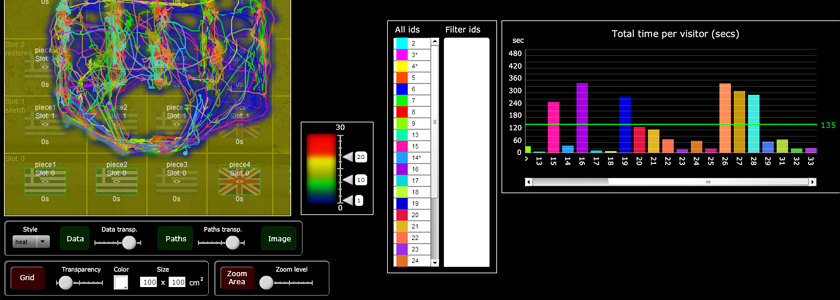
The main part of the visualization component’s user interface comprises a top-down view of the room and its interactive slots. On this view user paths are presented (using a different color for each distinct user). “Abnormal” (i.e., too long) path sections are presented using thicker lines. Additionally, accumulated user time spent on a specific area is illustrated in the form of a heat map. Users can get quantitative information about each point of the heat map by positioning the mouse pointer over it. Additionally, they can modify several parameters of this view, for example changing the transparency level of the paths or the heat map, hiding the background image, overlaying a grid and changing the coloring scheme of the heat map. Furthermore, they can zoom in any part of the view at different levels.
The interface also hosts a list which contains all detected user IDs. This list has a multifunctional role, since it: (i) works as a legend for correlating path colors to user IDs; (ii) highlights user IDs related to identified patterns (e.g., an asterisk ‘*’ is appended to IDs related to long path sections, a minus ‘-‘ to IDs with incomplete paths); and (iii) can be used to filter out data by selecting a subset of IDs (simply by clicking on them). Next to the IDs list, there is a graph presenting the total time spent by each visitor in the room and the average time for all visitors. Finally, there is an interactive control for setting a time period of interest that can be used for filtering data according to the time of their creation. The visualization component can be used to work with both real-time and stored data.